unreasonable expectations

This is a really nice blog from Brett Eaton on how we conceptualise river behaviour in research. It’s more technical than posts we normally cover, but should be a lot of interest to river managers.

Experimental Rivers Network

IMG_1010.JPGOne of the main problems with how we as a community have approached the study of river dynamics is that we have created unreasonable expectations for those that are charged with managing rivers. For example, we describe thresholds for channel scour and migration, but fail to mention that the thresholds are fuzzy, and that rivers are unpredictable, chaotic systems. When we make a a prediction that channel change should occur for a flood of magnitude X, and then nothing much happens during such an event, we look foolish and the managers  lose confidence in the underlying science.

View original post 824 more words

Posted in Uncategorized | Leave a comment

Grant for Master’s study in Hydrology

I’ve come across details of an excellent grant/award scheme for people looking to do an MSC in river and hydrology related courses with a view to moving into river/water management. The scheme is jointly run by the British Hydrology Society, the Environment Agency and JBA Trust (which is associated with hydrology consultancy JBA Consulting).

The award gives between £1,500 and £2,500 towards tuition costs for people doing a masters course at a UK university. The amount varies depending on the number of successful applicants.

Applications can be made on their online portal http://bhs-studentships.jbatrust.org/ and the closing date is 16th July 2017.

If you are looking for a masters course to do then our blog listing/reviewing all the UK courses from a few years ago is a good place to start!

The award is now in it’s 7th year, so if you are finding this post from the future it’s worth looking to see if it is still running.

Posted in Careers, Hydrology, prize, River Management, River restoration | Leave a comment

Looking into Selly Park Flooding

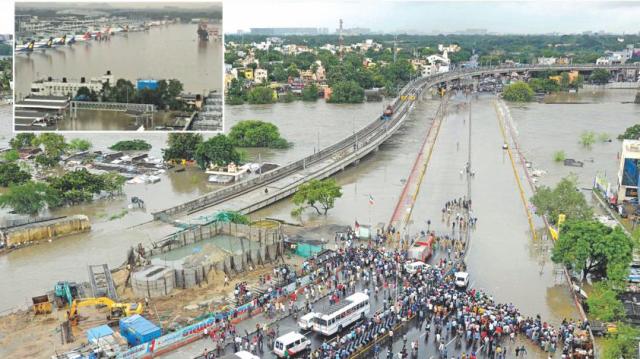
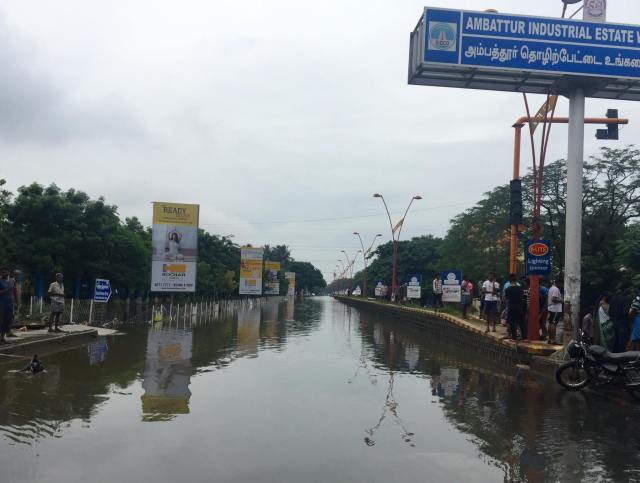
In June this year intense rainfall led to localised flooding in South Birmingham in and around University of Birmingham. One area which was particularly badly hit was Pershore Rd near the Birmingham Nature Centre. This area is near to the courses of the River Rea and Bourn Brook and there was some uncertainty afterwards about the extent to which the flooding was due to the river(s) over topping their banks (‘fluvial flooding’), or just to a failure of surface water drainage (‘pluvial flooding’).

I’ve written before about how immediately after flooding it’s not always helpful to try and blame something for the flooding. However, in contrast it’s really important to take time afterwards to try and understand if there are exacerbating factors which made flooding worse. Through understanding flooding mechanisms we can then better target alleviation measures. In the context of this flooding example the question is whether the flooding was driven by; the River Rea, the Bourne Brook(1), from drainage being overwhelmed, or some combination of these factors. If we understand how topography, river networks and drainage changes flooding behaviour, then we can design mitigation measures that will help alleviate it the future, but also make sure we don’t undertake expensive works which will have minimal effect.

I wanted to see what I could understand about the event by visiting the area the day after and by studying Geographical Information Systems (GIS) data.

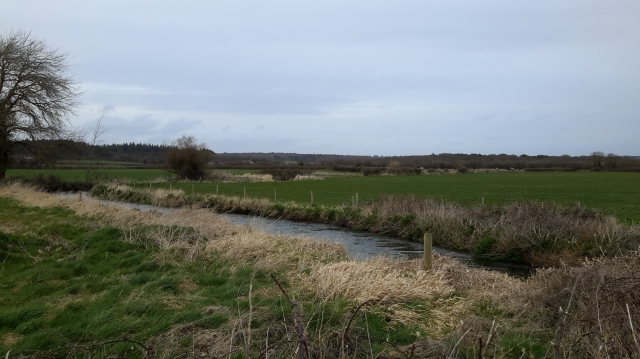
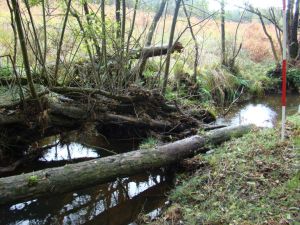
The River Rea at the back of Sir John’s Rd. Note how grass has been flattened on the banks, but the height of this is below the bank tops, indicating the river didn’t flood here.

The worst of the flooding was in Sir John’s Road off the Pershore Road. I had a look at the River Rea to the back of Sir John’s Road and the lines of trash and flattened grass indicated the Rea at it’s highest had been at least 50cm – 1m from over topping it’s banks (see above). Further down the Rea at the junction with the Bourn Brook it was the same story; the rivers looked as though they stayed in bank. I obtained some free Lidar data from the Environment Agency and made a digital elevation map on my laptop. This clearly shows the higher areas of Moor Green/Cannon Hill to the East, Selly Park to the SW and the University of Birmingham to the NW. With the flooded area sitting in a low lying region upstream of the Rea/Bourn Brook confluence.

AreaStreet2-floodarea

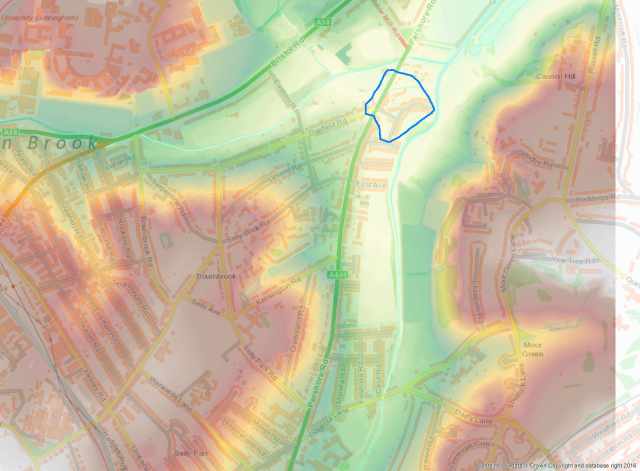
I made this map using free EA Lidar data and an OS basemap. The higher areas are red, going through yellow, green and with pale green/blue as the lowest. The main flooded area is shown in blue.

The Pershore Road bridge over the Bourn Brook had racking that at it’s highest was ~1-2m below the road surface, so indicates the Bourn Brook was unlikely to have flowed out onto the Pershore Road here. However there did seem to be a low lying vacant lot/area of scrub bordering the Pershore Rd, which may have been a route for the Bourn Brook to flood. There was also a lot of fine sediment deposition over the Pershore Road and Sir John’s Road, which indicates the water on the road might have been fluvial in origin, rather than just rain water.

Looking up Pershore Rd from near the junction with Sir John’s Rd. Note how road dips slightly to traffic lights, then rises again towards bridge (by bus in far distance). The low lying field/scrub bordering the Bourn Brook comes up to the trees on the left.

Wider-notes

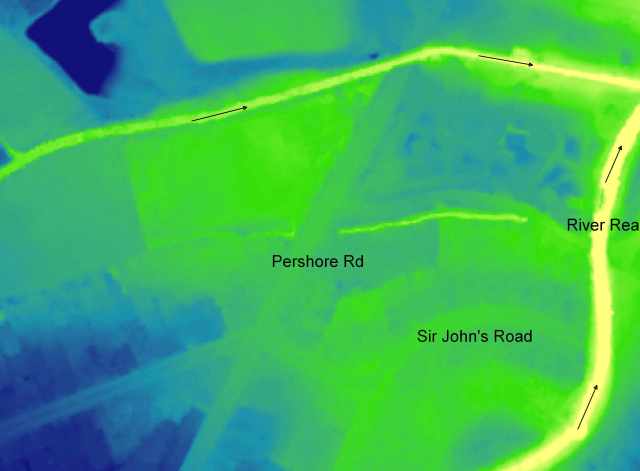
Digital Elevation Model of the area around Sir John’s Road. The Bourn Brook is yellow at the top, the Rea is marked at the right. The Pershore Rd goes roughly SW-NE. Sir John’s Road is the curving green line in the bottom right. The lowest land is yellow and bright green (the brighter the colour, the lower it is).

Looking in detail at the digital elevation model (above) we can see the rivers in bright yellow with the lower parts of the floodplain in green. The brighter the green, the lower the land. I’ve taken some spot height measurements from the DEM to quantify the relative heights of different places. Sir John’s Road itself is low lying at it’s junction with the Pershore Rd (115.05m to datum), and slightly slopes down to the T-junction in the middle (114.17m). The Pershore Road is slightly higher (115.47m at the Bourn Brook bridge), and all roads around here slope towards the junction of Sir John’s Road and Pershore Road. This means water will flow into Sir John’s Road from several directions and not be able to get out over land. If you look at the video here, at 0.02 seconds it shows the junction of Sir John’s Road and the Pershore Road, looking ~NE up the Pershore Rd and seems to show water flowing from the direction of the Bourn Brook towards and possibly down Sir John’s Road.

The height of the Sir John’s Rd terminus by the R.Rea is 114.72m (over half a metre higher than the T-junction in the middle) and Fourth Avenue to the South is 114.62m (45cm higher than the T-junction). This all means the middle of Sir John’s Rd is around half a metre lower than all the roads that lead to it – it is a small bowl-like depression. To make matters worse for the effects of the flooding, the back gardens on the left side are ~114.30m and the right side are ~114.20m; they are about the same elevation as the lowest part of the road and crucially, lower than any other route out for the water. This means once surface water is in Sir John’s Road it is likely to flow into the houses unless the drains can cope with moving it away. At the very least water will be at around half a metre deep in the area in photograph below before it inundates the ends of the road at all (In the photo below Ford Transits have ~44cm wheels so it would be at the top of the wheel arches, my bike panniers have a clearance of ~30cm so my sandwiches would be getting wet).

The lowest part of the road. There is only one drain here (under the parked van). This area is around half a metre lower than the surrounding roads.

The fine scale DEM below shows a likely progression of the flooding. I believe the key is a low lying plot of land (#3) to the West of the Pershore Road and bordering the Bourn Brook. Here the brook is only 1.14m below the surface of the field; a lower bank than anywhere else along the river and so likely the first place to flood.In contrast the difference between the height of the brook and road at the bridge is over 4m. I believe all these factors combined to lead to the flooding as illustrated below.

wider_overlay-flood2

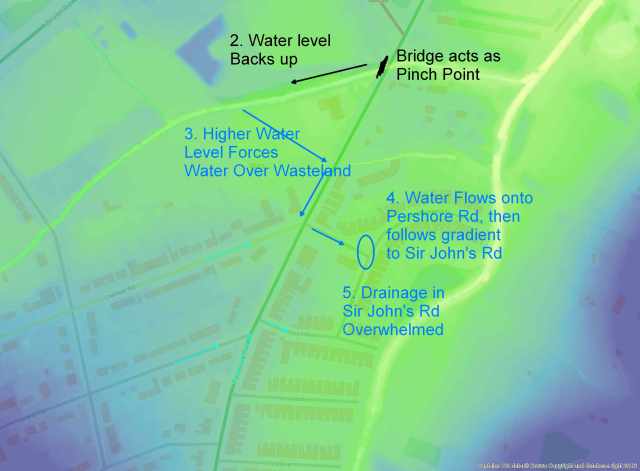
Likely step-by-step anatomy of the flooding.

The map above shows the general sequence of events which I believe lead to the flooding on Sir John’s Road. There is also the possibility intense rainfall was causing water to flow down some of the other nearby roads as well, here the topography would also have funnelled any such flood water into the Sir John’s Road depression. In my opinion the two key areas which would be most obvious to tackle in terms of raising flood resilience would be to redesign the drainage in Sir John’s Road to improve the capacity and to install property level protection for houses on the street.

Fourth Avenue looking down Sir John’s Road. There is one small drain on the right side by my bike (just out of shot), the next drain on this side of the road is by the blue cul-de-sac signs in the distance.

The surface water drainage in Sir John’s Road is in my opinion very inadequate to cope with the challenges of being a locally low lying area prone to surface water flooding. There are a only handful of small drainage grates here. I would not be surprised if these may lead to nuisance surface water flooding in heavy, but unexceptional rain, particularly if poorly maintained. I can’t see how they could cope with extreme events. Increasing drainage capacity might seem obvious, and would likely be useful, but it would not be a panacea in all flood events. A key consideration is even if drainage capacity was improved, there may not be a gradient from the surface drains to the Rea in large floods to move the water away, so the drains would back up. Effectively the Rea may rise without overtopping it’s banks, but still be sufficiently high that it is above the level of the drains, meaning water can’t easily drain off Sir John’s Road into the Rea. I don’t have enough information to say whether that could have happened in this event.

The R.Rea upstream of the Bourn Brook confluence. I believe the small terracotta pipe is part of local surface water drainage (for Nature Centre). Note if the river rises by ~1m it will submerge pipe outflow.

The another option is to redesign the Pershore Rd bridge; this is part of my analysis which is pure (informed) speculation. We just don’t know the extent to which the bridge played a role as a pinch point; backing up and raising water levels upstream. Even if the bridge were not there the water level in the Bourn Brook may have been high enough to flow across the low lying field onto the Pershore Rd (or may be in a future event). Some detailed flood modelling work could explore this. The other option would be to install flood walls or dykes on the river banks along the Bourn Brook, or possibly even set back against the Pershore Rd to lessen the chance water could flow across the field onto the Pershore Rd.

The weather leading to the June flooding in Birmingham was unusual, and should, even with climate change, remain a rare event. However with some further detailed analysis and remedial flood mitigation work around the Rea/Bourn confluence and in and around Sir John’s Road it should possible to lessen the devastating effects of flooding on residents in future extreme rainfall events.

Disclaimer: Given the sensitivity of the subject I want to emphasise the contents of this article are the personal opinions of the author. The opinions expressed are based on available information/data which allow no more than informed speculation and should not be taken as a detailed hydrological assessment. I hope it goes without saying that this article should not be used as a blueprint for undertaking any works.

(1) – Interestingly Bourn in Old English means brook or burn, so the Bourn Brook is the “Brook Brook”.

Posted in Flooding, Geomorphology, Hydrology, River Management, Urban rivers | Tagged , , , , , , | Leave a comment

Can we justify preserving landscapes for heritage?

This is a post I’ve mulling over for nearly a year on and off. As a society we now commonly restore rivers to improve water quality or for ecological benefits, and as recent posts on here have demonstrated we may be able to restore rivers as part of flood mitigation. We could probably categorise all of these benefits as “ecosystem services”, in that management changes to the river are designed to deliver tangible ecological or hydrological benefits. On occasion programmes to “restore” rivers are met with opposition from stakeholders. The most common objections I have seen are: where restoration is perceived to have a potentially detrimental effect on recreation or other river uses (e.g. fishing), where there is the perception that the restoration will cause economic losses to stakeholders (e.g. loss or degradation of productive agricultural land), or because stakeholders resist change because they attach a value to the landscape in its current form.

wpid-20150329_181101.jpg

The River Frome near Lower Bockhampton

Last year I visited Dorset and walked around the Frome water meadows near Lower Bockhampton. These water meadows are an iconic English landscape providing the back drop to many of the novels of Thomas Hardy, particularly Tess of the d’Urbervilles, in which they were the “Vale of the Great Dairies”. Water meadows also feature in some of the paintings of John Constable. These landscapes could therefore be described as having cultural, and agricultural heritage value. Despite their potential importance for heritage they are primarily a working agricultural landscape and as agricultural practice changed the economic viability of water meadows declined and now working examples are very rare. Many water meadows are described as being in a “derelict” state, which isn’t as bad as it sounds! By derelict it means they are a man-made landscape which has ceased to be managed or operated for its original purpose. Contrary to the impression given by the word “derelict” they tend to be rich, biodiverse landscapes with lush grassland and old, partly silted up and sometimes ephemeral channels. These features contribute to a mosaic of habitats with many marginal ecological niches for important species such as water voles and many derelict meadows are classed Sites of Special Scientific Interest (SSSI).

“The river itself which nourished the grass and cows of these renowned dairies, flowed not like the streams in Blackmoor. Those were slow, silent, often turbid; flowing over beds of mud into which the incautious wader might sink and vanish unawares. The Var* waters were clear as the pure River of Life shown to the Evangelist, rapid as the shadow of a cloud, with pebbly shallows that prattled to the sky all day long. There the water-flower was the lily; the crowfoot here.”

The Vale of the Great Dairies, from The Wessex of Thomas Hardy by Bertram Windle. *The Var is The Frome in the novel.

wpid-20150329_184943.jpg

Frome Valley, “The Vale of the Great Dairies” in Tess of the d’Urbervilles

A traditional bedwork water meadow, typical of those in chalk stream valleys of Southern England, is a very complex system of channels and drains designed to periodically flood the grassland with a thin, fast moving, sheet of river water. The idea is that the river water warmed the soil and enriched it with deposited silt, promoting grass growth. Furthermore as the water was fast flowing it was sufficiently oxygenated to allow grass to grow even when submerged. This ensured lambs in water meadow environments had access to grass up to six weeks earlier and that the land produced abundant hay crops up to four times that of non-irrigated meadows.

The problem in terms of how we value these landscapes is that I have been able to find very little evidence that water meadows managed in the traditional way provide a net biodiversity and ecological improvement over the meadows in their derelict state (albeit that the different landscapes favour different specific species). It is therefore difficult to make a case they should be conserved for ecological reasons. As a result efforts to converse and preserve these landscapes are focused on the landscape heritage value and indeed such efforts are championed by Historic England (formerly English Heritage); not a body I would normally think of in connection to river restoration.

wpid-20150329_182231.jpg

Artificial channel built to convey water into the irrigation network for the water meadows, now just part of a multi-thread river system.

Historic England report that when considering restoration of water meadows it is more popular to manage them as disused systems to benefit wading birds and meadow plants, with a New Environmental Land Management Scheme in place to assist this.

So we are left with something of a quandary, it would be a tragedy if all the water meadows in England disappeared (admittedly an unlikely occurrence with meadows at Salisbury owned/managed by the cathedral), but it is very hard to make a case for retaining them on anything other than cultural heritage, which isn’t normally a major (let alone the only) driver for managing a river landscape. What I think this example illustrates is that although we can do a lot of good science in relation to river management ultimately landscape management is not all a game of weights and measures and there has to be room for less substantial and even emotional considerations.

wpid-20150329_182544.jpg

I believe this is a sluice (back right) for draining water off the meadows, but it is hard to be sure with the current state of repair. All the kids are taking selfies these days.

This further makes me think about the current debate for afforesting hill slopes; in areas such as Cumbria and Wales for example where the hills are historically managed for sheep farms and in areas in Scotland and Yorkshire where uplands are managed for moorland similar arguments could be made for the agricultural and cultural heritage value of these iconic landscapes. That’s not to say that I believe such values are likely to outweigh the potential for value through flood mitigation and increased ecological richness of upland forests, but it is important to acknowledge such values are placed onto the landscape when making and consulting on management decisions. Certainly thinking about the cultural value of landscapes has given me a new perspective on anti-restoration groups I came across (and I have to admit initially dismissed) in the New Forest.

I’d be really interested to hear people’s experiences of valuing landscapes that perhaps aren’t otherwise viable, or management experiences of dealing with conflicting values. Is it even important to preserve landscapes which are part of our cultural heritage?

Posted in Chalk streams, Ecology, Geomorphology, River Management, River restoration, Water quality | Tagged , , , , , | 2 Comments

How wood in rivers affects flood risk – revisted

Regular readers of the blog will remember a few years ago I blogged about some of my PhD research on trying to assess how changing volumes of wood in rivers affects the likelihood and magnitude of flooding. At the time I felt the work was stuck in a metaphorical publishing logjam and thought it would be a while, if ever, before it got published in a journal. In a wonderful piece of serendipity a colleague who was editing a special edition of the journal Earth Surface Processes and Landforms read the blog and thought the work would be a good fit and so invited me to submit it. The paper was recently peer reviewed and accepted for publication. I mention this as an anecdote to counter what academics are sometimes told about blogging damaging chances of publication, or being a waste of time. Following the work being through the rigours of peer review I thought it was a good time to revisit it and reblog the major findings* now it’s all scientifically official!

The background to this work is that we know if wood is put into a river then flood water moves slower through/around it, and thus for a short distance downstream flood water will have a longer “travel time”. What no-one has done before is look at the effects upon flooding at a distant downstream location (such as a town) of changing the speed water moves through a small sections of the river catchment upstream of it. What we were interested in, and what the EA provided funding to look at, is how changing land use and/or changing in-stream wood quantities (particularly in the context of river restoration) could change downstream flood behaviour. This idea of natural flood risk management is a really hot topic recently covered on Countryfile, The One Show, The Today Programme and many more.

To investigate land use and flooding we used a computer model called OVERFLOW which was also used for the experimental “soft engineering” flood defence project at Pickering, N.Yorkshire which has received a lot of attention since this winter’s floods. This model allowed us to run thousands of model variations to look at the effects of changing wood in rivers and changing afforestation at a wide range of scales, but also different spatial arrangements within a catchment. In order to set up and calibrate the model we used data on topography, land use, rainfall and river levels for a catchment within the New Forest National Park – the Lymington River. We were principally concerned with the depth of water near the town of Brockenhurst.

The key points that emerged from the modelling study are:

  • Adding artificial logjams to stretches of river as short as 500m can change the height of a flood peak in a downstream town, but these changes are very small and have highly variable magnitude and directionality.

To unpack this point a little more – putting logjams into a river in some locations can increase the depth of flooding downstream.

  • Broadly speaking steep headwater reaches with wood in them had little to no effect on downstream flooding – in very simple terms this can be put down to the water flowing in steep streams moving faster and having more energy, and thus being less susceptible to being significantly slowed by additional wood. I found streams with a slope of >0.005m/m or greater showed little change in flood peak upon adding wood.
  • In middle to lower parts of the catchment changes in flood height at the town are observed, but there is little predictability in response. I.E. with my data I am unable to predict whether putting wood into a river channel around 3-15km upstream of a town will decrease or increase flood risk.
  • Generally as the length of river with wood in it increases, the magnitude of change in the flood peak height also increases – i.e. wood in more river channels results in bigger changes to flooding. However the direction of this change remains highly variable.
DSC03959

Meander bend during flood, looking downstream. River channel flows from left to right, before curving back towards top left. Water is flowing rapidly over the floodplain on the left, bypassing the bend in the river.

The overall conclusion is that just inserting wood and/or logjams into rivers within a catchment as part of flood control for a downstream location is highly unpredictable. The reason for this is that locally logjams force water out onto the floodplain, if this floodplain is grass or scrub then the flood water is capable of still moving fairly rapidly across it, indeed in some cases it can flow directly down-valley and bypass bends in the river.

The real benefits in “rewilding” for flood control comes from restoring floodplain forests. Complex forested floodplains dramatically slows water moving over them as they have an irregular surface covered by tree roots, upright tree trunks and dead wood. Our model runs for scenarios where wood is inserted into the river and a forest is allowed to grow on the floodplain show substantial and predictable responses in downstream flood height.

  • Restoring floodplain forests to short sections of river of 1-2km can reduce downstream flood height by 1% after 25 years growth.
  • There is predictable pattern of response with floodplain forest in lower parts of a catchment (e.g. near a town), increasing flood height. However when used in the middle and upper reaches of a catchment a reduction in flood height is modelled.
  • As the extent of restoration increases the magnitude of change in downstream flood peak increases and displays a similar spatial pattern (near the town increases flood height, further upstream reduces flood height)
figure4espl

This Figure from the paper shows the spatial pattern of flood response to very small areas of afforestation (A=~25yr, B=~50yr, C=~100yr). Note how upper parts of the catchment are neutral or blue (reduce flood risk) and areas close to the outflow (bottom right) are red (increase flood risk), and how this pattern gets stronger as the forest ages (A-B-C).

A map showing an example of a sub-catchment area. This one is 14.6% of the total area and if forested is predicted to lead to a 5.3% reduction in flood peak height after 25 years growth

A map showing an example of a sub-catchment area. This one is 14.6% of the total area and if forested is predicted to lead to a 5.3% reduction in flood peak height at the downstream urban location after 25 years growth

The most promising scenarios, and the real take home message is the restoration of floodplain forests to entire “sub-catchments” of the main catchment (a tributary of the main river and all streams draining to it) always decreases flood peak height after 25 years growth, and can have dramatic effects. If this is done for areas of 20-35% of the catchment reduction in flood peak height  of 10-15% are modelled after 25 years of forest growth.

As a simple analogy during a flood many “packets” of water are delivered to the main trunk river from all its tributaries. If the delivery of a single large “packet” of water can be significantly delayed it will then arrive at the main river after the peak of the flood, and thus the main flood peak height has less “packets”of water in it and is lower. Imagine it as a tapas meal where you’ve ordered too many dishes, your table is full already, but thankfully the waiter brings your albondigas after the gambas pil-pil are finished and thus your table doesn’t overflow with tapas.

Figure 7espl

This conceptual model from the paper illustrates the concept of “sub-catchment desynchronisation”, and explains how slowing the flow in one place can make flooding worse elsewhere.

The two most important implications for flood control using river restoration or re-wilding are:

  • Applying wood and/or logjams on their own to short stretches of river of 1-5km has a highly variable effect on flood peak height at a downstream urban location of ±4%. The (well known) local flood wave attenuation effects of logjams do not always translated to reduced downstream flood risk. Given the difficulty in predicting the response before installation this is a highly risky approach and should probably be avoided unless there is extensive site experience/local knowledge/investigation beforehand.
  • The most promising (and practical) scenarios are to restore small headwater sub-catchments representing 10-15% of the total catchment area, where reductions of 5-6% in flood peak height can be seen after 25 years, with this reduction increasing to 7-8% after 50 years growth. If the area is increased to a large sub-catchment representing 25-35% of the catchment area reductions of 10-15% in flood peak magnitude can be seen after 25 years (with again bigger reductions as the forest ages and matures); although restoration of such large areas may prove impractical.

It is important to note that this modelling only looks at the speed of water moving through the river network and off hillslopes, it does not take any account of the reductions predicted in the amount of water reaching rivers through trees increasing infiltration rates of rain/runoff into soils, as George Monbiot has talked about extensively. So we could expect to see even greater reductions in flood peak discharge downstream than predicted just from flood wave travel time modelling.

In conclusion although governmental and public interest in the concept of “rewilding” rivers for flood control is promising, it is important to recognise that the local effects of wood in rivers slowing flow can have surprising and counter-intuitive effects when looked at in the context of a whole river catchment. We need to do a lot more work in this area and in the meantime the insertion of logjams and dead wood into rivers for flood control should be used with caution and extensive site analysis. Scientifically the case is getting much stronger for targeted afforestation of uplands as a part of natural flood risk management.

*- elements of this post have been copied from the early blogpost linked to above.


Posted in Uncategorized | 7 Comments

Do we need rivers to secure water for development?

To celebrate World Wetlands Day we have a special guest blogpost from Helen Parker & Naomi Oates of the Overseas Development Institute (ODI) and Catherine Moncrieff & Dave Tickner (WWF).

odi2

The Nile River in Jinja Uganda, Helen Parker

Do we need rivers to secure water for development?

On World Wetlands Day, most of the readers of the blog would probably think the answer is, of course, ‘yes!’ However, what this means in practice isn’t always so obvious. Rivers are often neglected in water security discourses focused on economic growth. There appears to be a conceptual gap between these narratives and ecosystem services research which advocates for the protection of rivers.

Our recent research aims tries to bridge this gap by exploring the complex relationship between rivers and society, unveiling how rivers provide important benefits and are therefore a key component of sustainable development.

Here we highlight five key points about rivers and their potential benefits, as a useful starting point to optimise river management and secure water for development.

  1. Rivers provide a wide range of benefits to society, and these benefits depend on river health in different ways

The potential social, economic and strategic benefits that rivers provide are shown below. Many social benefits derived from rivers are dependent on good ‘all round’ river health. These include tourism, use of the river for cultural practices, or livelihoods which depend on inland fisheries or flood recession agriculture. Economic benefits, such as those derived from commercial agriculture or hydropower, tend to rely on one or two aspects of river health, primarily flow, and require built infrastructure such as dams. Strategic benefits, such as poverty reduction and food security, are indirectly related to river health and the causal relationships are more difficult to prove. Optimal river management recognises the numerous complex links between river health and benefits to society.

odi1

  1. Not all benefits from rivers are mutually compatible

Some river benefits, particularly those requiring large infrastructure, have significant trade-offs. For example, dams built for hydropower or large scale irrigation exert environmental, economic and social costs and can have negative feedbacks on river health. Optimal river management involves better accounting for the costs of large infrastructure in river development decision making.

odi3

Murchinson Fall, the Nile River, Uganda, Helen Parker


  1. Often rivers are managed for a narrow range of benefits

Major river development is often focused on delivering a single or narrow range of objectives, such as power generation or flood protection. This limits realisation of other benefits and presents trade-offs in terms of river health and other human needs. Poor river management can also increase the risks associated with rivers, including flooding and disease. Optimal river management involves managing rivers to achieve a wide range of benefits.

  1. The distribution of river benefits to society is often uneven

The costs of poor river management are not equally distributed. Often, the poor are disproportionately affected by negative environmental impacts, as poorer households rely on functional river ecosystems for their livelihoods. People who live in close proximity to rivers may also bear a high proportion of the costs, such as those communities who are displaced by hydropower dam construction, while other groups in society benefit. Meanwhile, a person’s ability to access benefits often depends on social structures and informal rules, for example gender or caste. Formal institutions and decisions made in favour of powerful actors may exclude marginal groups. Optimal river management requires explicit consideration of who wins and who loses, and how to compensate the latter.

  1. “Hardware” and “software” is needed to realise river benefits

Reaping river benefits requires “hardware” such as dams and transport, as well as “software” such as regulations, permits and market access. For example, sluice gates and irrigation channels are needed to deliver irrigation water, but management institutions, regulations and water permits are needed to enable farmers to access and use water effectively. The ability for farmers to earn income from irrigation water is also contingent on access to farm inputs, markets and market prices, which depends on other variables. Having a healthy river is not enough: optimal river management for multiple benefits requires a mix of hardware and software.

odi4

A fisherman prepares for the evening catch, near Gisenyi, Rwanda, Helen Parker

Our research urges decision makers to take a holistic view which recognises the range of benefits offered by rivers and strives for optimal river management. Protecting rivers isn’t the whole answer for securing water for sustainable development, but an essential part of it.

 These five points are based on research conducted by the Overseas Development Institute (ODI) in collaboration with the World Wildlife Fund (WWF). A similar version of this blog was posted on the WWF website.


This post is cross posted from the excellent WWF blog, as ever, please leave your comments and thoughts below. Simon

Posted in guest blog, River Management | Tagged , | Leave a comment

What about beavers?

17870-a-beaver-swimming-pv

“Beaver Shot” by Paul Stevenson is licensed under Creative Commons Attribution 2.0.

My first research projects were on logjams, looking at their abundance, distribution, form and function. These logjams were naturally occurring as a result of wood being “recruited” to the channel via wind throw or overbank transport. However ever since I started to do research on logjams there has been the spectre of beavers and their lodges looming over me. Rather oddly, wherever I gave a conference presentation on logjams the questions afterwards would inevitably contain a very open ended question along the lines “what about beavers?” It got to the point where it became a bit of a standing joke and if it hadn’t been asked after a few questions, one of my friends in the audience would helpfully supply a beaver related question.

Picture2

A wonderful news story about parachuting beavers in Idaho from Joe Wheaton’s website

To date I haven’t done any research on beavers, but motivated by trying to provide better answers to the tangential conference questions, and out of curiosity, I’ve read a fair bit on the subject. Beaver are often mentioned in discussions of river restoration or natural flood risk management (NFM). In the UK there are currently controlled reintroduction projects and limited “wild” beavers. I’ve come to realise through conversations on twitter that beavers and river restoration/flood management is a subject where the scientific thinking is quite different to general assumptions about their behaviour and potential to be a part of NFM.

A new paper in Geomorphology summarises this quite well:

“Enthusiasm surrounding simplicity and cost-effectiveness of beaver may lead to unrealistic expectations about beaver’s ability to restore streams, and, in particular, restore channel-floodplain connectivity”.

The paper; “Modelling the capacity of riverscapes to support beaver dams“, uses a model to predict where beaver may build dams (and where they won’t) and validates this against the locations of nearly 3000 observed dams in Utah.

Picture3

Beaver dam in US (© Joe Wheaton)

What this study shows is that the presence of suitable riparian vegetation near to the river bank is a fundamental control on dam building. In the US this is Aspen, Willow, Cottonwood and Alder trees. Put simply if these trees aren’t growing (fairly abundantly) within 30m of the river bank it is fairly unlikely beavers will build a dam, even if all other conditions are optimal. When looking at their validation data, particularly where they found real world dam abundance was lower than the model suggests could be supported, they attribute this partly to a history of livestock grazing suppressing woody riparian vegetation and I understand the authors have developed a model to explore this aspect in more detail.

The other important secondary controls are a flow regime which sits in a “goldilocks zone”, in which the base flows are low enough that dams can be constructed, but where flood flows are not so large they destroy dams, and in which additionally the channel gradient is neither so low that dam density is limited, but not so high that stream power precludes dam building and/or persistence in floods. Finally the river needs to be sufficiently small (in width) for the beaver to be able to construct channel spanning structures.

Fig-7-Modeled-existing-beaver-dam-capacity-at-the-reach-scale-250-m-segment-for-all

Figure 7 from the paper showing predicted beaver dam abundance.

The model predictions show that ecological, hydrological and geomorphological constraints restrict the actual (and potential) locations for beaver dams in Utah.

These principles and findings are important in a UK context. Many lowland rivers have only sparse woody riparian vegetation, and many of the upland streams which do flow through forest may be too steep to support beaver colonies. It is true that beaver could have a really important role to play in flood mitigation, but fundamentally beaver are a tool for managing riparian forests and so a precursor to any strategy which seeks to use beaver would need to be riparian forest planting/restoration/protection. This is just a hunch, not supporting by analysis, but I suspect vast tracts of the UK river network would be currently “tree limited” with respect to sustaining beaver colonies.

Applying the methodology of this paper to (parts of) the UK would be a valuable step in understanding which catchments in the UK could currently support beaver, and, by implication, this would also predict where they would go/not go if more widely reintroduced. With slight modifications to the modelling approach it would also be possible to predict where could support beaver colonies if it had the right riparian vegetation. These two steps together could then help to inform river managers in the UK as to where might be suitable sites to undertake beaver driven flood mitigation.

Beaver could be a valuable part of future flood mitigation, but currently they are not the panacea they are sometimes put forward as. If the UK seeks to use a fundamentally wood driven tool as part of flood mitigation it will need the riparian trees to support this.


For more info about beavers and research visit http://beaver.joewheaton.org/

Posted in Ecology, Flooding, Geomorphology, Hydrology, paper review, River Management, River restoration | Tagged , , , , , , , | Leave a comment

What is a flood?

C3TOzb6

Flooding in Chennai © Drury Mirror (http://i.imgur.com/C3TOzb6.jpg)

I read an interesting article on the BBC website today about the extensive flooding in Chennai, India. Tamil Nadu has seen huge amounts of rain recently, in the wettest December for 100 years and large parts of the city, including the airport are underwater. I’ve been paying particular attention to this event as I worked for a number of years with companies in Chennai and have many friends there. The article I mentioned fits in with a strange phenomenon I’ve written about before on the blog; the rush to apportion blame for flooding, something I don’t believe happens to the same degree for other natural disasters.

Essentially the article is blaming poorly planned development and a lack of awareness of nature for the flooding, which seems to be a common refrain when discussing adverse flood impacts. What struck me while reading the article was the disconnect between the natural event and the effects of that natural event, which got me thinking about what we even mean (popularly) when we talk about “a flood”.

I think it can be useful to break a flood down into the two components: the event and the effects. Thinking about the event itself, the EU flood directive defines a flood as “a covering by water of land not normally covered by water”. In almost all definitions of a flood there is no mention of impacts, so philosophically a flood could occur even if no-one was there to see it or feel its effects! A flood is not contingent on human impacts, but is a natural event.

By and large, water covering an area of normally dry land is going to have its source in (abnormal) rainfall. Although there is some evidence human activities can have an impact on rainfall patterns, we can normally take the source rainfall as a fixed variable, i.e. there is next to nothing that can be done by humans to manage rainfall rates. When thinking about the raw volume of water within a catchment basin the principle losses from the system are going to be evapotranspiration, and typically these losses will be low during a rainfall event. So what we are left with is an essentially invariable quantity of water (in terms of human impact) delivered to, and within, a catchment for a given storm.

In terms of human impact on whether a flood occurs we are therefore left with our ability to affect timings of delivery of the rainfall into rivers and down the channel network to areas which may or may not be flooded. Our ability to influence the speed of water transfer is largely driven by land use. As most people will be aware, impermeable concreate areas transfer water quickly and efficiently into channels, forested areas tend to do so more slowly (with a spectrum of land use in between). It is possible; in short duration events (as shown in some of my work), to manipulate the speed of water transfer in different parts of a catchment and so affect flood magnitude and duration. However, there is a really important concept in hydrology related to this issue, which is “time to equilibrium”; this is the time taken for a drop of rain falling at the most distant part of the catchment to reach a downstream area we are interested in. IF a rainfall event persists for a length of time approaching the time to equilibrium (e.g. a long duration rainfall event), and if the rainfall rate is sufficient to lead to flooding, then any land use effects of slowing or speeding transfer of water will be irrelevant in terms of whether a flood will occur. Flooding may be quicker, deeper, longer or shorter, depending on human management, but it will occur in that rainfall event. This is important because from a hydrological point of view floods occurring from long duration weather events such as the ones in Chennai or in Somerset a few years ago are inevitable. It is never correct (hydrologically) to say that human impacts caused the floods.

12304309_10208329677259272_1479986427168778020_o

Flooding in Chennai industrial estate (© Rajkumar Rajagopal)

Where human intervention is vital is in the effects of that inevitable flooding upon infrastructure, but more importantly, people. As the article points out, the human interventions can include:

  • Developments on high risk areas, where infrastructure and people are exposed to the flooding
  • A disconnect between people and the environment such that at-risk groups are ill prepared for flooding and thus the impacts of flooding upon them are more severe.
  • A lack of planning on the part of emergency services and governments such that evacuation and mitigation plans are poorly thought out, ineffective or completely absent.

These are the areas which are ripe for critical analysis by government bodies; principally how can they make sure they minimise the number of people and quantity of vital infrastructure that is exposed to flood risk. How can they make sure that individuals and organisations are aware of the risk they are living with and know what to do when a disaster occurs? In the case of Chennai tackling planning laws and the application of them to prevent building in high risk areas and increasing awareness of risk would be really important steps to minimising future flood impacts. I’ve written about this before in Indian flooding, where (in a different hydrological context) the narrative was very similar, focused unhelpfully on stopping floods, rather than mitigating their impacts.

I can only disagree with Nityanand Jayaraman’s concluding statement:

“Clearly, indiscriminate development and shoddy urban planning have led to the floods in India’s fourth most populous city.”

However I think a compelling case could be made for a modification:

Clearly, indiscriminate development and shoddy urban planning have directly led to, or at least exacerbated the impacts and damage from floods in India’s fourth most populous city.

It can actually be damaging to the aim of minimising flood impacts to suggest that floods such as the one in Chennai would be avoidable with better planning, as this can actually hamper raising awareness of living with risk. It’s important we focus on what we can change and do better in order to properly prepare cities around the world for a likely future increasing in flooding through climate change.

Posted in Uncategorized | 1 Comment

Not all logjams are created equal

DSC04708

Logjam in the New Forest

I was excited this week to have a paper accepted in the journal Ecohydrology, not least as I think the findings could prove to be really useful for river restoration and river management. In this post I want to try and break down the implications of the research for river management/restoration practise. At a later date I’ll break down some of the science implications in another post.

At its simplest the paper is trying to link together the geometric form and architecture of a logjam and the changes in local erosion and deposition associated with it. There is a wealth of information in the academic literature on the effects of logjams at promoting particular features/habitats, such as a greater number of logjams in a river being related to a greater number of pools. Many river managers and river restoration professionals will probably know how to install a “tree kicker” to promote the scouring of fine sediment and creation of exposed gravels, by using an angled piece of wood to concentrate ambient flow and promote local scour.

However, perhaps surprisingly, there isn’t much in the literature (academic or professional) linking what a logjam looks like and what it does in terms of geomorphology. This makes it very hard for professionals to design engineered logjams to accomplish a particular management objective. One of the key objectives I had was to try and understand if there was a link between, for example, bigger logjams and a higher likelihood of a pool forming, or logjams against one bank and scour.

Without going into too much detail about the method the main principle is to collect measurements of the logjam itself and the geomorphological change to the channel around it, along with measurements of the channel dimensions. All the measurements are then converted to ratios, for example by dividing logjam width by channel width, making it much easier to compare between sites. I end up with 7 variables, and do a cluster analysis on these so that all the logjams in my river “clump together” statistically into groups. This reveals the biggest groups, or types of logjam in a river and also what the architecture and geomorphological effects of these logjam groups are.

We can display these logjam clusters as radar plots (fans of console games will notice this is similar to how sports games display player stats!), which allows us to compare visually the different types.


explanation_radar

Basic radar plot showing the seven variables and how these are calculated from field measurements

One of the key findings of the paper is the link between the relative sizes of the logjam (compared to channel cross section) along with its porosity (the amount of void space in the structure) and the association with erosional or depositional features. A low porosity is key as it increases hydraulic resistance and backs up water behind the logjam (rather than allowing it to flow through the structure), this then either spills over the top, scours underneath or is diverted towards a bank. It’s this concentration of flow, with an associated increase in velocity, that leads to focused erosion and the creation of pools/bank erosion.

figure2

The main logjam clusters from the study river. Note that the upper 3 arms [ A* (cross section filled), Z* (logjam width/channel width) and 1-phi (porosity)] describe the main architecture, the four lower arms of the radar describe the effects on geomorphology & hydraulics. (from Dixon, 2015 fig. 2)

I found that channel spanning logjams tend to be the ones which create pools, but this is strongly linked to porosity and to the size of the structure. Broadly speaking a logjam with very low porosity (so a tight structure packed with leaves and fine wood) produces a pool, and this pool is typically deeper for a larger structure. Large logjams with moderate porosity tend to produce some geomorphological effects, but these tend to be smaller magnitude and are somewhat tricky to predict (scour, lateral erosion, bar formation).

The importance of porosity is also seen for smaller logjams, where I found two distinct types of logjams which partially fill the channel; those with loose structures which do very little geomorphologically, and those with moderate to low porosity which divert flow and cause moderate bed scour.

So the overall message would be; if a manager can afford to be relaxed about exactly what geomorphological change is occurring within a given reach, then tight logjam structures with low porosity (both channel spanning and partial) appear to be the best way to increase general geomorphological hetrogenity (pools, berms, scour, lateral migration) and thus habitat provision.

There are lots of caveats here, the most important being these are statistical results from just one river. If engineered logjams were designed based on these results in a similar river, and if there were a hundred of them, the overall patterns should hold true. However it is very hard to predict the effects of a single logjam based on its structure (yet). The plan is to conduct more research in other rivers using this method (and hopefully other researchers will also adopt it and we can combine our results), this will allow us to really firm up some guidance for building engineered logjams to achieve specific goals.

The paper will be put into my University’s archive as open access soon and I’ll update this post with a link once that happens.

Posted in Uncategorized | Leave a comment

Celebratory Give Away

You could win THIS. This is an actual thing.

You could win THIS.
This is an actual thing.

At some point this week I anticipate we’ll pass 50,000 views for the River Management Blog, which was beyond our wildest hopes when we started it off a little over two years ago.

To celebrate this milestone I am going to give away a very special gift/prize to one lucky fan of the blog. A River Management Blog branded mug!

All you need to do to be in with a chance of winning this extremely limited and hardly sought after non-collectors item is to either:

a) Tweet a link to any story from the River Management Blog tagging @woodinrivers (so I register the entry)

or

b) Write a comment below telling us which is your favourite River Management Blog post

If you want to you can do both and I’ll enter you twice!

At the end of the month I will do a random draw for the winner and post you your mug (so make sure if you comment I’ve got some way of contacting you!)

Good Luck!

Posted in prize | 2 Comments